欢迎访问《电化学(中英文)》期刊官方网站,今天是
高级检索
|
图表检索
Toggle navigation
首页
期刊信息
期刊介绍
编委会
数据库收录
作者中心
征稿简则
论文范例
作者指南
在线投稿
出版伦理
读者中心
最新录用
当期目录
过刊浏览
全年目录
阅读排行
下载排行
引用排行
审稿中心
专家审稿
主编审稿
编委审稿
编辑登录
编辑政策
期刊订阅
联系我们
English
图/表 说明
高级检索
期刊
DOI
请选择
电化学(中英文)
起始年
结束年
请选择
1995
1996
1997
1998
1999
2000
2001
2002
2003
2004
2005
2006
2007
2008
2009
2010
2011
2012
2013
2014
2015
2016
2017
2018
2019
2020
2021
2022
2023
2024
2025
2026
请选择
2026
2025
2024
2023
2022
2021
2020
2019
2018
2017
2016
2015
2014
2013
2012
2011
2010
2009
2008
2007
2006
2005
2004
2003
2002
2001
2000
1999
1998
1997
1996
1995
卷
期
作者
作者单位
期刊
出版年
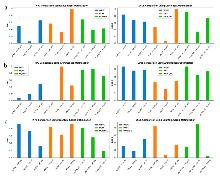
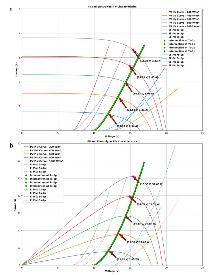
Figure 10.
Impacts of Availability Levels on Cost and Efficiency. (a) Levy Flight Optimization, (b) Archimedean Optimization, (c) Quantum Gorilla Optimization
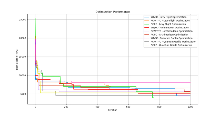
Figure 9.
Convergence curves of all algorithms for different combinations.
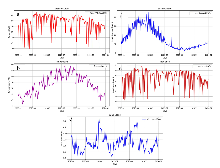
Figure 8.
Power-time curves of all components of the system under climatic conditions. (a) total PV output, (b) Temperature, (c) Wind speed, (d) Load demand and (e) Irradiance
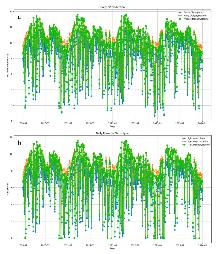
Figure 7.
(a) Daily power PV production; (b) Daily power electrolyzer production
Table 4. Summary of the configurations and results for the Electrolyzer-PV integration study
Figure 6.
(a) Operating points of optimum electrolyzer systems at different Irradiance of PV system I-V characteristics. (b) Operating points of optimum electrolyzer systems at different Irradiance of PV system P-V Characteristics
Table 3. Geographic coordinates and climatic information on the sites
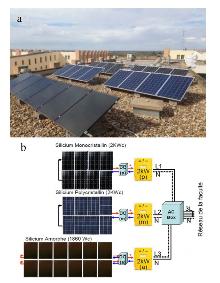
Figure 5.
(a) Three photovoltaic plants in Beni Mellal. (b) Detailed properties of the PV panels
Figure 4.
Quantum Gorilla Optimization
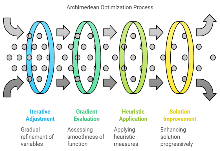
Figure 3.
Archimedean Optimization Process
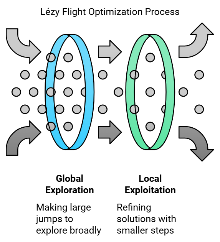
Figure 2.
Levy Flight Optimization (LFO) Process
Table 2. Properties of all components on specifications of inverters.
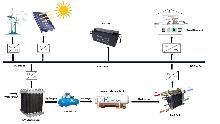
Figure 1.
Off-grid hybrid power supply system.
Table 1. Comparison of common optimization methods for hybrid renewable energy system design and their performance characteristics
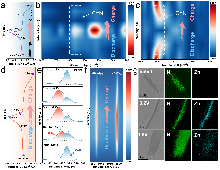
Figure 5.
Structural evolution and energy storage mechanism of the DPQP cathode during the redox process. (a) A GCD curve. (b) Ex-situ FT-IR image, (c) Raman image at various electrochemical states. (d) A GCD curve. Ex-situ XPS spectra of (e) N 1s and (f) Zn 2p during discharge and charge. (g) TEM-EDS of N and Zn elemental distributions of DPQP electrodes at 0.2 V and 1.8 V.
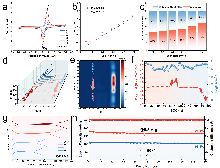
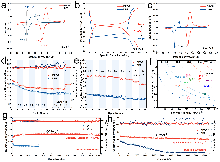
Figure 4.
The reaction kinetics of DPQP cathode. (a) CV curves of DPQP at different scan rates and (b) calculated b values. (c) Calculated capacitance/contribution ratios at different scan rates. (d) In-situ EIS curves and (e) DRT result of DPQP. (f) GITT test of DPQP and calculated ionic diffusion coefficients of Zn
2+
. (g) Wide temperature performance at 0.1 A·g
–1
within the temperature from –20 to 60 ℃. (h) Cycling performance of DPQP at 0.5 A·g
–1
at –20 and 60 ℃.
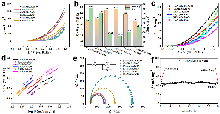
Figure 3.
Electrochemical performance. (a) CV curves, (b) GCD curves at 0.1 A g
-1
and (c) corresponding dQ/dV curves of DPP and DPQP. (d) Rate performance and (e) corresponding discharge voltage of DPP and DPQP. (f) The comparison of DPQP and reported cathode materials in capacity, voltage, and energy density. Cycling performance of DPP and DPQP at (g) 0.1 A·g
-1
and (h) 10 A·g
-1
.
Figure 2.
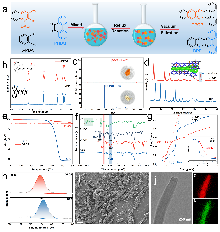
Materials synthesis and characterization. (a) Synthesis route of DPP and DPQP. (b)
1
H NMR spectra, (c) HRMS, (d) XRD patterns, (e) TG analysis curves, (f) FTIR spectra, (g) Tauc-plots (inset shows the UV-Vis DRS spectra), (h) XPS N 1s spectra of DPP and DPQP. (i) SEM image. (j) TEM and corresponding EDS mapping images of DPQP.
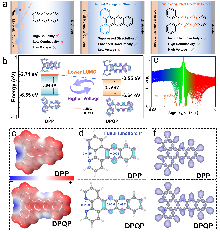
Figure 1.
Design strategy of high-voltage n-type cathode material. (a) Schematic illustration of molecular engineering on electrochemical performance of organic cathode. (b) LUMO-HOMO energy levels of DPP and DPQP. (c)ESP and (d)Fukui function plots of DPP and DPQP. (e) The IRI isosurface map of DPQP molecules. (f) ELF color-filled mappings of DPP and DPQP.
Figure 4.
Electrochemical activity of HzOR: (a) CVs of various catalysts in 0.1 mol·L
-1
NaOH + 50 mmol·L
-1
N
2
H
4
at a scanning rate of 50 mV·s
-1
. (b) Comparison of onset potentials and current densities at 1.6 V (vs. RHE). (c) LSVs at 5 mV·s
-1
and (d) Tafel lopes on various catalysts. (e) EIS of various samples. (f) Stability test of HzOR on (Co,Ni,Mn,Cu,Zn)O HEO-NTs.
跳至
页
第1页
共176页
共3514条记录
首页
上一页
下一页
尾页