欢迎访问《电化学(中英文)》期刊官方网站,今天是
高级检索
|
图表检索
Toggle navigation
首页
期刊信息
期刊介绍
编委会
数据库收录
作者中心
征稿简则
论文范例
作者指南
在线投稿
出版伦理
读者中心
最新录用
当期目录
过刊浏览
全年目录
阅读排行
下载排行
引用排行
审稿中心
专家审稿
主编审稿
编委审稿
编辑登录
编辑政策
期刊订阅
联系我们
English
图/表 说明
高级检索
期刊
DOI
请选择
电化学(中英文)
起始年
结束年
请选择
1995
1996
1997
1998
1999
2000
2001
2002
2003
2004
2005
2006
2007
2008
2009
2010
2011
2012
2013
2014
2015
2016
2017
2018
2019
2020
2021
2022
2023
2024
2025
2026
请选择
2026
2025
2024
2023
2022
2021
2020
2019
2018
2017
2016
2015
2014
2013
2012
2011
2010
2009
2008
2007
2006
2005
2004
2003
2002
2001
2000
1999
1998
1997
1996
1995
卷
期
作者
作者单位
期刊
出版年
Scheme 1.
Proposed mechanism for the paired electrochemical syntheses of benzothiophenes
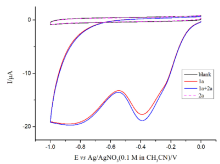
Fig. 3.
Cyclic voltammograms of related compound (5 mmol·L
-1
) in 0.1 mol·L
-1
Bu
4
NBF
4
/DMSO
Table 3. Syntheses of 9-arylphenanthrene derivatives
a,b
Table 2. Syntheses of 2-Arylbenzothiophenea
a
Table 1. Optimization of reaction conditions
a
Fig. 2.
The syntheses of 2-substituted benzothiaphenes
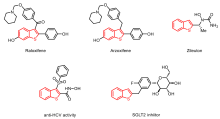
Fig. 1.
Representative structures containing the benzothiophene framework
Fig. 5.
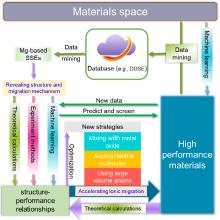
A proposed scheme for obtaining high-performance SSEs from a complex material space of divalent ion SSEs. Data mining will play a key role in capturing promising divalent ion SSE materials as the basis, and an integrated strategy across subsequent data mining, theoretical calculations and modeling, and experiments will be used to reveal the ionic migration mechanism and structure-performance relationships of the potential SSEs. Finally, the ionic migration of these SSEs will be accelerated by considering various optimization strategies.
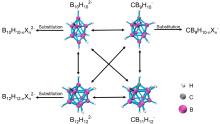
Fig. 4.
Different anion structures of closo-type materials and halogen analogs. X represents different halogen atoms (F, Cl, Br, and I) [
58
]. Note that halogens’ atomic volumes are larger than the hydrogen atom, and electrostatic potential distribution is more heterogeneous, which could lead to a higher cation ion migration barrier [
60
].
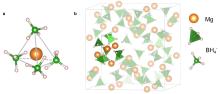
Fig. 3.
Illustration of Mg
2+
migration in ternary spinel MgSc
2
Se
4
. Mg
2+
will overcome an energy barrier to migrate from a to b (i.e., the “tet-oct-tet” pathway). A larger atomic volume is expected to result in a larger triangle plane for a more facile ionic migration.
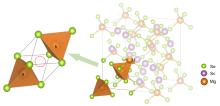
Fig. 2.
The structure framework of Mg(BH
4
)
2
. (a) Coordination configuration of Mg
2+
and four [BH
4
]
-
. (b) Structure of a cubic Mg(BH
4
)
2
. Mg
2+
is located at the center of a regular tetrahedron constructed by four [BH
4
]
-
anions.
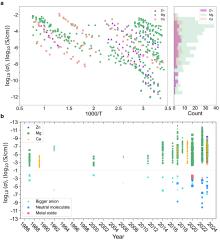
Fig. 1.
Statistics of divalent-ion-conducting materials published during the past 40 years. (a) Distribution of divalent-ion-conducting SSEs as a function of temperature. The right frame shows the counts of SSEs in a diverse range of ionic conductivity. (b) Reports of Mg-, Zn-, and Ca-ion SSEs, where the diverse colors present different SSEs in the upper picture, and the lower picture shows the optimized strategies in Mg-based SSEs.
Fig. 14.
Electrolyte flow velocity distributions of (a) concave-convex structure electrolyte flow velocity distribution, (b) rhombus structure electrolyte flow velocity distribution (c) wedge structure electrolyte flow velocity distribution and (d) expanded mesh structure electrolyte flow velocity distribution; (e) Velocity profile on the transversal line at different y positions on the reference
x
-
y
plane (z = 2.7 mm)
Fig. 13.
Current density distributions with (a) concave-convex structure, (b) rhombus structure, (c) wedge structure and (d) expanded mesh structure
Fig. 12.
Four types of channel structure
I
-
V
curves
Fig. 11.
(a) H
2
distribution in cathode flow path and (b) O
2
distribution in anode flow path
Fig. 10.
(a) Locations of the transversal line for study (
x
-
y
plane,
z
= 2.7 mm); (b) Velocity profile on the transversal line at different y positions on the reference
x
-
y
plane (
z
= 2.7 mm); (c)
x
=0 section flow velocity map; (d)
y
=0 section flow velocity map; (e) Electrolyte flow velocity distribution inside the electrolytic cell; (f) Flow velocity contours
Fig. 9.
(a) Electrolyte current density distribution in bipolar plate concave-convex channel field; (b) Electrolyte current density contour plot
Fig. 8.
Main view of electrode current density at Hz= 2.7 mm (electrode-bipolar plate contact interface)
Fig. 7.
(a) Side view of the current density distribution on the electrodes inside the electrolytic cell (b) Main view of the current density distribution on the electrodes at different height interfaces
跳至
页
第1页
共176页
共3501条记录
首页
上一页
下一页
尾页