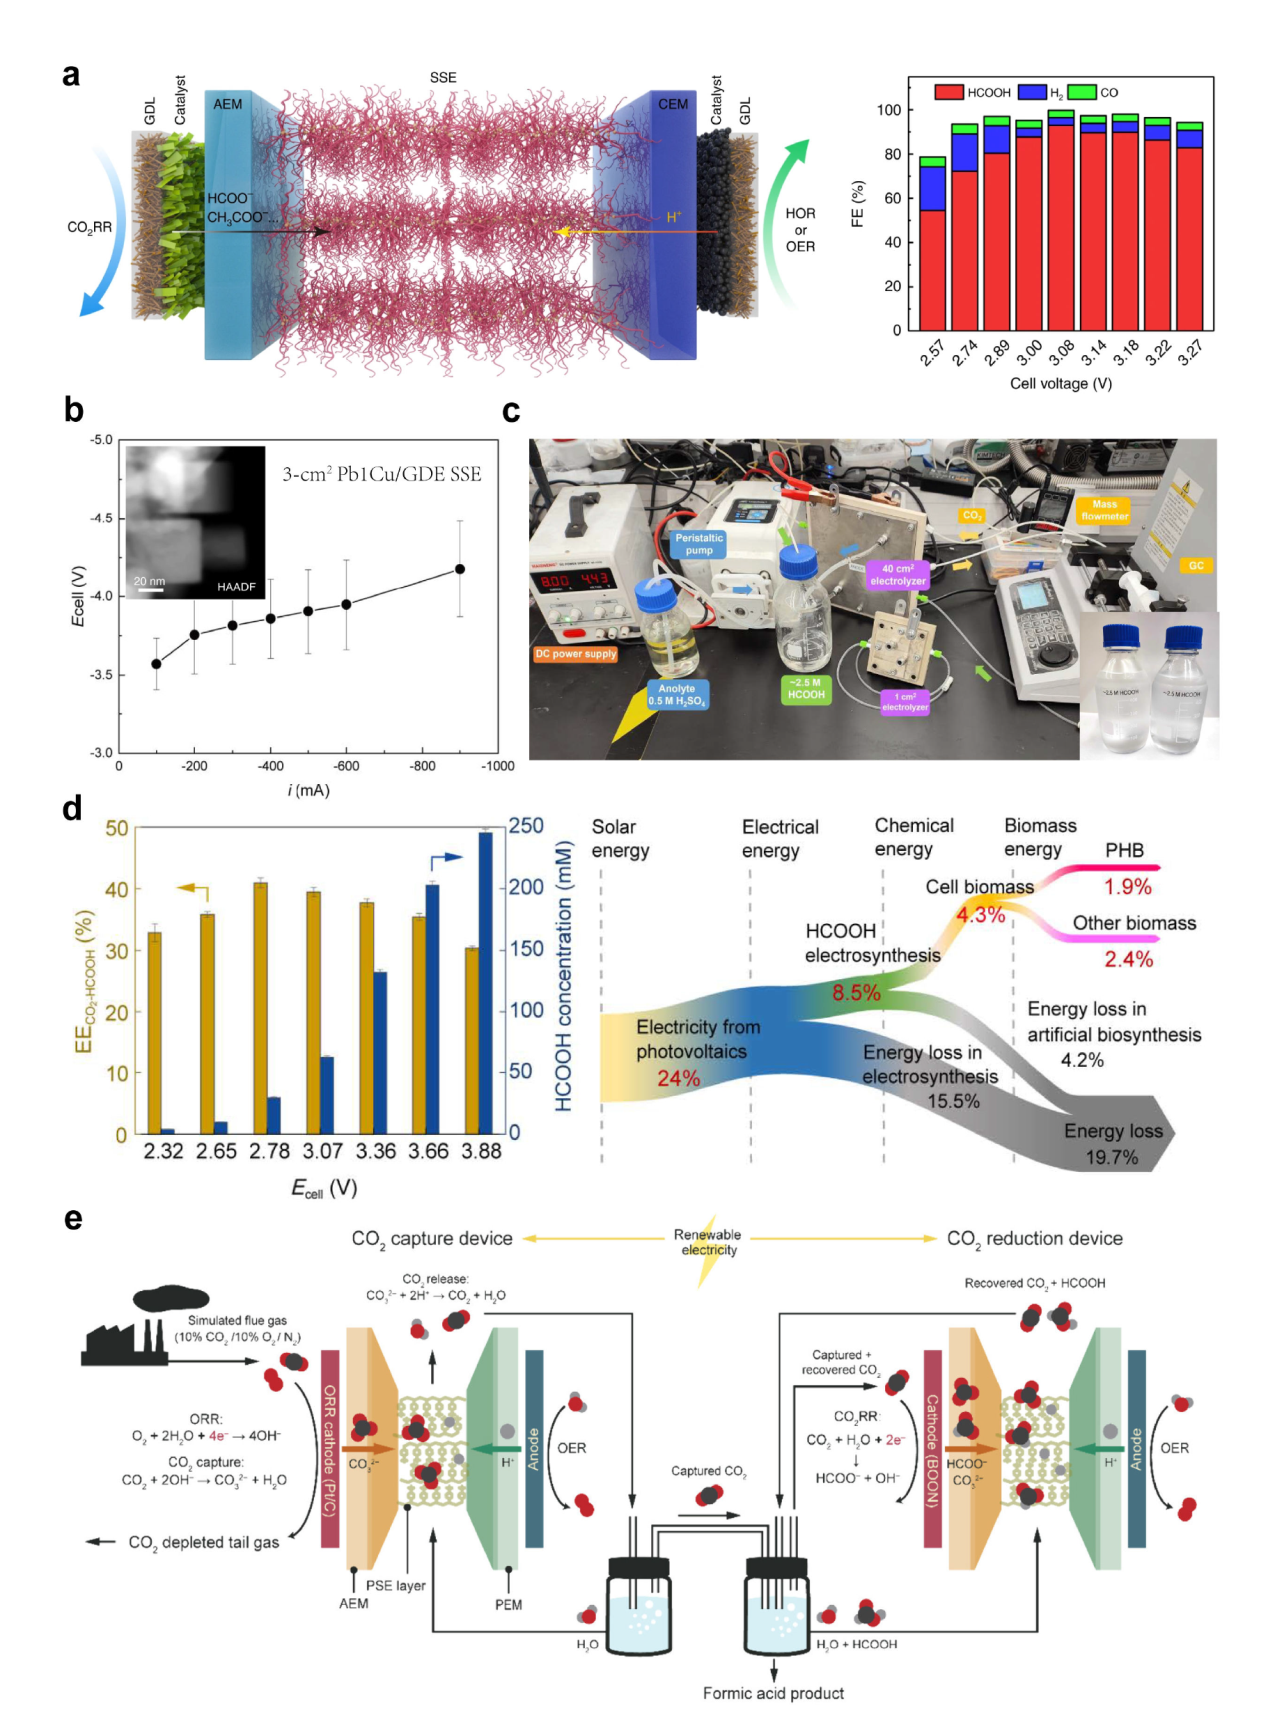
Figure 4. CO2RR enabled by SSE. (a) The SSE configuration for HCOOH synthesis and the HCOOH FE under different cell voltage [42]. Reproduced with permission of Ref. [42]. Copyright 2019, Springer Nature. (b) The I-V curve of Pb1Cu catalyst during SSE electrolysis (inset: TEM image of the catalyst) [62]. Reproduced with permission of Ref. [62]. Copyright 2021, Springer Nature. (c) A 40-cm2 SSE set up for continuous production of 2.5 mol·L-1 HCOOH [63]. Reproduced with permission of Ref. [63]. Copyright 2024, National Academy of Sciences. (d) The energy efficiency and HCOOH concentration under series of cell voltage with the energy flow diagram coupling with biosynthesize [64]. Reproduced with permission of Ref. [64]. Copyright 2021, Springer Nature. (e) A tandem system combing electrochemical CO2 capture and conversion from simulated flue gas [65]. Reproduced with permission of Ref. [65]. Copyright 2025, American Chemical Society.
|