平衡、非平衡、交流状态下电化学双电层建模的初学者指南
A Beginners’ Guide to Modelling of Electric Double Layer under Equilibrium, Nonequilibrium and AC Conditions
平衡、非平衡、交流状态下电化学双电层建模的初学者指南 |
| 张露露, 李琛坤, 黄俊 |
|
A Beginners’ Guide to Modelling of Electric Double Layer under Equilibrium, Nonequilibrium and AC Conditions |
| Lu-Lu Zhang, Chen-Kun Li, Jun Huang |
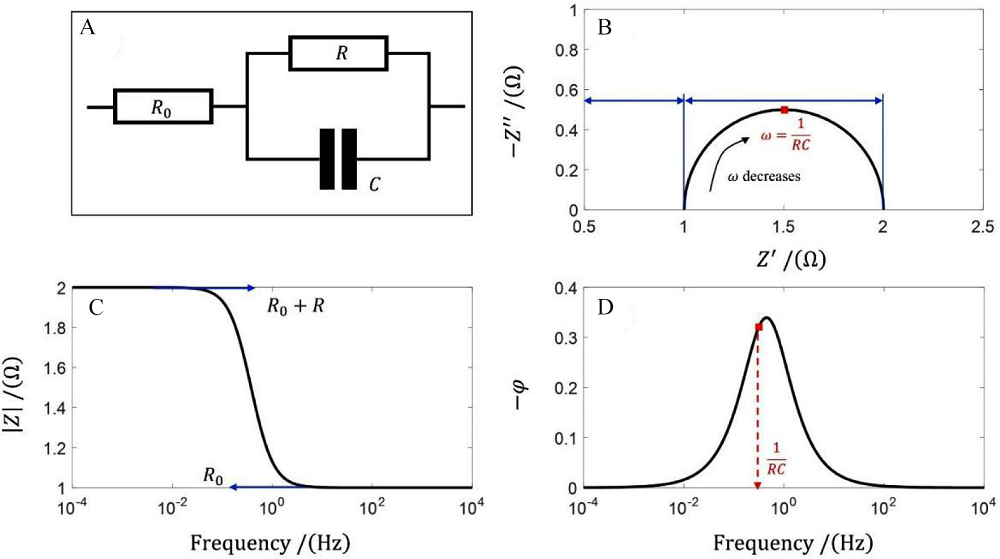
| Figure 10. (A) A simple RC electrical circuit; (B) The Nyquist plot; (C) The Bode plot of amplitude; (D) The Bode plot of phase angle. The parameters used for calculation are as follows, R0 = R = 1 Ω, C = 0.5 F, and the frequency range: 1 × 10⁻⁴ Hz to 1 × 10⁴ Hz. Matlab script of this model is provided in the supporting information. (color on line)pedance amplitude and the frequency is shown in |
|
|